Economic Inactivity by the Over 50s, the Cost-of-Living Crisis and Adult Training

Statisticians count employment statuses in a short sequence. If you do one hour or more of paid work, you are ‘in employment’. If you’re not ‘in employment’, then if you are both looking for work and available to start, you are unemployed. Everyone else is economically inactive. And so, you can have the same unemployment rate with very different proportions of the population who are inactive.
The inactive are asked the main reason they aren’t looking for work. The categories used are: students; long term sick or disabled; looking after family; retired; and a ragbag of other responses. Importantly, students in full-time education can be in any category – employed, unemployed and inactive.
Current Pattern of Economic Inactivity
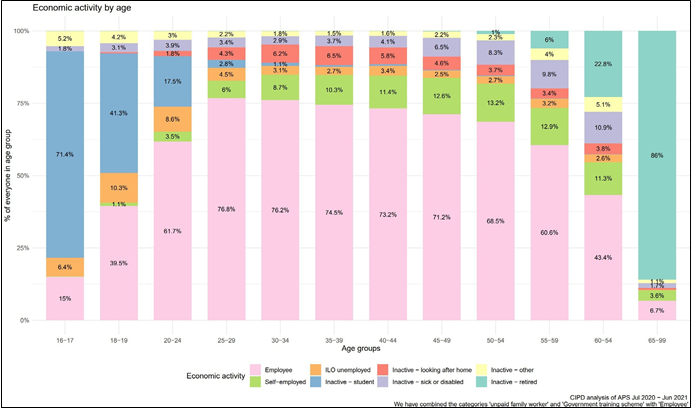
CIPD has produced a useful chart showing the pattern of economic inactivity by age (see Figure 1). The data is for the year from July 2020 to June 2021. The age pattern is broadly consistent with earlier and later figures.
The top five segments are inactive categories.
The vast majority of full-time students – participating in further as well as higher education – are under the age of 25, therefore, there are few inactive full-time students aged 25 and over.
Retirement, on the other hand, starts over the age of 55, becoming significant in the 60-64 age-group.
Inactivity looking after family is concentrated between the ages of 30 and 44. It is mostly female. This group has reduced over the years.
The inactive sick or disabled category is around 3% of the population until age 40, after which there is an increase with age up to over 10% of the 60-64 population.
Women have higher rates of inactivity looking after family, which peaks under 12% of women aged 35-39.
Recent Changes in Economic Inactivity
The groups where economic inactivity has risen in 2021-2022 are older people and those with long-term sickness or disability, or both. There has been a change in trend for those looking after family too, where earlier falls have been replaced by small rises.
Economic Inactivity by Prior Level of Qualification
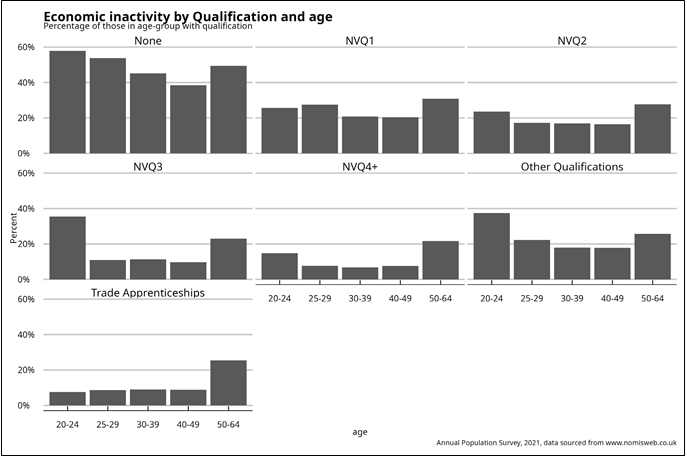
People with lower levels of qualifications are more likely to be economically inactive (or unemployed) than higher qualified people (see Figure 2). Critically, the same age patterns apply (with small variations) for each group.
Those with no qualifications are very likely to be inactive at any age – for most age groups over 40% are inactive. About 20% of those with qualifications equivalent to Level 1 are inactive, rising for the over 50s. Inactivity is lower, but still high, for those with Level 2 qualifications. Meanwhile, those with Level 3 and 4 qualifications have low inactivity, apart from the Level 3 aged 20-24 (who may still be full-time higher education students) and the over-50s.
Other qualifications have similar patterns to Level 2, except for younger ones who may be studying. Plus, trade apprenticeships have low inactivity, similar to people with Level 4+ qualifications.
Economically Inactive Over 50s with Low or No Qualifications
There are high numbers of the over 50s with low qualifications – with nearly 600,000 over- 50s having no qualifications and being economically inactive. This is more than half of the total 20-64 economically inactive with no qualifications.
The Cost-of-Living Crisis
The cost-of-living crisis is spreading from initially being fuel and energy costs dominated into other spending items (partly due to the fuel and energy used by suppliers of those items). Earnings have not been keeping up with price rises (nor have benefits).
People have different spending patterns by educational experience – with those with the longest time spent in education (mainly graduates) being more likely to be paying mortgages and low qualified paying rent.
People with lower qualifications are more likely to be economically inactive (or unemployed) than higher qualified people.
The Cost-of-Living Crisis
The cost-of-living crisis is spreading from initially being fuel and energy costs dominated into other spending items (partly due to the fuel and energy used by suppliers of those items). Earnings have not been keeping up with price rises (and nor have benefits).
People have different spending patterns by educational experience – with those with longest education (mainly graduates) being more likely to be paying mortgages and low qualified paying rent.
People with lower qualifications are more likely to be economically inactive (or unemployed) than higher qualified people.
Household Spending by Date Leaving Full-Time Education
In 2019, families where the ‘household reference person’ left full-time education at 16 (approx. 6 million families) had an average spend of £211.90 a week. The 2020 and 2021 figures are affected by pandemic responses, so 2019 gives a better picture.
Date leaving Full-Time Education
There are no figures by qualification, but age of leaving full-time education is a reasonable proxy. Families headed by someone who left full-time education aged 17-19 spent 11% more than those who left at 16. For those who left full-time education aged 19-22, 37% more, and for those who left later, 38% more than those who left at 16.
Type of Spending
Just under two-thirds of spending across all education groups goes on four spending groups. These groups match up with the CPI ‘basket’ items, with the exception of mortgage payments and Council Tax. These are outside the CPI. It is this group of spending that has the biggest variation with the date of leaving education – from 11% of spending for age 16 leavers, to 15% for leavers aged 19+.
The other big spending items are: transport (fuel and fares); housing, fuel and power (where housing is rent); recreation and culture; and food and non-alcoholic drinks. Variations in percentage spending are (on average) small across the education groups, except the ‘other expenditure items’.
The spending groups that are most immediately affected by the rapid rises in fuel costs are housing, fuel and power and transport. The other groups get affected later as energy costs flow into the cost of delivering goods and services, such as food.
However, even if people have relatively similar spending patterns in percentage terms. The impact of price rises is greater on those with lower incomes – as a higher proportion of that spending is on need rather than choice.
Future Pressure on Family Budgets
Since 2019, inflation has affected those leaving full-time education earlier worse than those who left later. This is without taking account of changes in mortgage interest payments. The difference is small, but present. However, forecasts for inflation and taking into account fuel costs make that far worse for 2022-23 and 2023-24. This will put pressure on family budgets – and those families closer to the line will be in most danger.
Adult Training and the Economically Inactive Aged 50 and Over
Everybody aged 50 and over reached 16 before the National Curriculum was introduced in 1988. Therefore, qualifications at 16 would include many Certificates of Secondary Education (where the highest Grade 1 was equivalent to later GCSE C).
Overall qualifications for people aged 50 and over are low by comparison with younger people, but there may be many apprenticeships and vocational qualifications that are difficult to rate against current standards.
Where people are interested in returning to work, or need higher incomes now, they may see a need for specific employment-related training. ONS surveyed older people and found that 26% of those interested in returning to work did not feel they had all the skills to get a new job.
For those currently in work who have returned already, it is likely that they have returned to a less demanding job than before. The leading skills people wanted to improve were: advanced IT, such as data science and programming; and creative skills, such as performance, web design or product design. This was followed by presenting and negotiating.
Beyond these, it is likely that people will need updating in application and interview skills, and there may be a need for assessment of the skills they do have – hiring managers may not be able to interpret a 1990 or earlier (pre-NVQ) vocational qualification.
This is as much a problem with manager education as for the older person. Many will have learned much through their work that has never been formally assessed, and some assessment here may be useful. This is the same issue that appears in large-scale redundancies, where it is common for a skills task force to be set up.
Recommendation 1
Interview and CV writing skills for economically inactive 50 year-olds and over to secure employment are vital. DWP should prioritise this.
Recommendation 2
DWP should widen the opportunity for economically inactive 50 year-olds and over, whether on benefits or not, to participate in specific employment-related training.
Recommendation 3
DfE and DWP should work with employers to remind hiring managers of historic qualifications achieved by unemployed and inactive 50 year-olds and how they equate with today’s system, as well as support updating where necessary.
By Paul Bivand, Independent Labour Market Analyst
This article is part of Campaign for Learning’s series: Learning in the cold: The Cost-of-Living Crisis and Post-16 Education and Skills
Order of series
Day 1
Friday 21st October
- Louise Murphy, Economist, Resolution Foundation: The Cost-of-Living and the Energy Crisis for Households
- James Kewin, Deputy Chief Executive, Sixth Form Colleges Association: The Cost-of-Living Crisis and 16-19 Year-Olds in Full-Time Further Education
Day 2
Saturday 22nd October
- Becci Newton, Public Policy Research Director, Institute for Employment Studies: The Cost-of-Living Crisis and 16-18 Year-Olds in Jobs with Apprenticeships
- Zach Wilson, Senior Analysis Officer and Andrea Barry, Analysis Manager, Youth Futures Foundation: The Cost-of-Living Crisis and 16-24 Year-Olds ‘Not in Full-Time Education’
Day 3
Monday 24th October
- Nick Hillman, Director, Higher Education Policy Institute: The Cost-of-Living Crisis and Full-Time and Postgraduate Higher Education
- Liz Marr, Pro-Vice Chancellor – Students, The Open University: The Cost-of-Living Crisis and Part-Time Higher Education in England
Day 4
Tuesday 25th October
- Steve Hewitt, Further Education Consultant: The Cost-of-Living Crisis: Access to HE and Foundation Year Programmes
- Sophia Warren, Senior Policy Analyst, Policy in Practice: The Cost-of-Living Crisis, Universal Credit, Jobs and Skills Training
Day 5
Wednesday 26th October
- Paul Bivand, Independent Labour Market Analyst: Economic Inactivity by the Over 50s, the Cost-of-Living Crisis and Adult Training
- Aidan Relf, Skills Consultant: The Cost-of-Living Crisis and Employer Demand for Level 2-7 Apprenticeships
Day 6
Thursday 27th October
- Mandy Crawford-Lee, Chief Executive, UVAC: The Cost-of-Living Crisis and Employer Demand for Level 4+ Apprenticeships and Part-Time Technical Education
- Simon Parkinson, Chief Executive, WEA: The Cost-of-Living Crisis and Adult Community Learning
Day 7
Friday 28th October
- David Hughes, Chief Executive, AoC: The Cost-of-Living Crisis and FE Colleges
- Jane Hickie, Chief Executive, AELP: The Cost-of-Living Crisis and Independent Training Providers
Day 8
Saturday 29th October
- Susan Pember, Policy Director, HOLEX: The Cost-of-Living Crisis and Adult Education Providers
- Martin Jones, Vice-Chancellor and David Etherington, Professor of Local and Regional Economic Development, Staffordshire University: The Cost-of-Living Crisis – The Response of Staffordshire University
- Chris Hale, Policy Director, Universities UK: The Cost-of-Living Crisis and Universities


Responses